

KPI on the Fly AI: What Instant BI Taught Me About Dashboards
KPI on the Fly AI is a portfolio experiment exploring how AI can propose draft KPIs and dashboard views from a dataset for analyst review.
By Khalil Abu Mushref · ·
The gap between asking a business question and seeing a reviewed number can be frustrating: the question takes seconds to say, while a trustworthy answer may take days or weeks to define, model, validate, and publish.
Those weeks have a familiar shape. A stakeholder wants one figure, and the machinery grinds into motion — a ticket, a requirements meeting, a data model, a dashboard build — until, by the time anything ships, the person who asked has either hacked a workaround together in Excel or stopped caring. As a senior business analyst and BI developer working in fintech, I have watched that cycle play out more times than I can count.
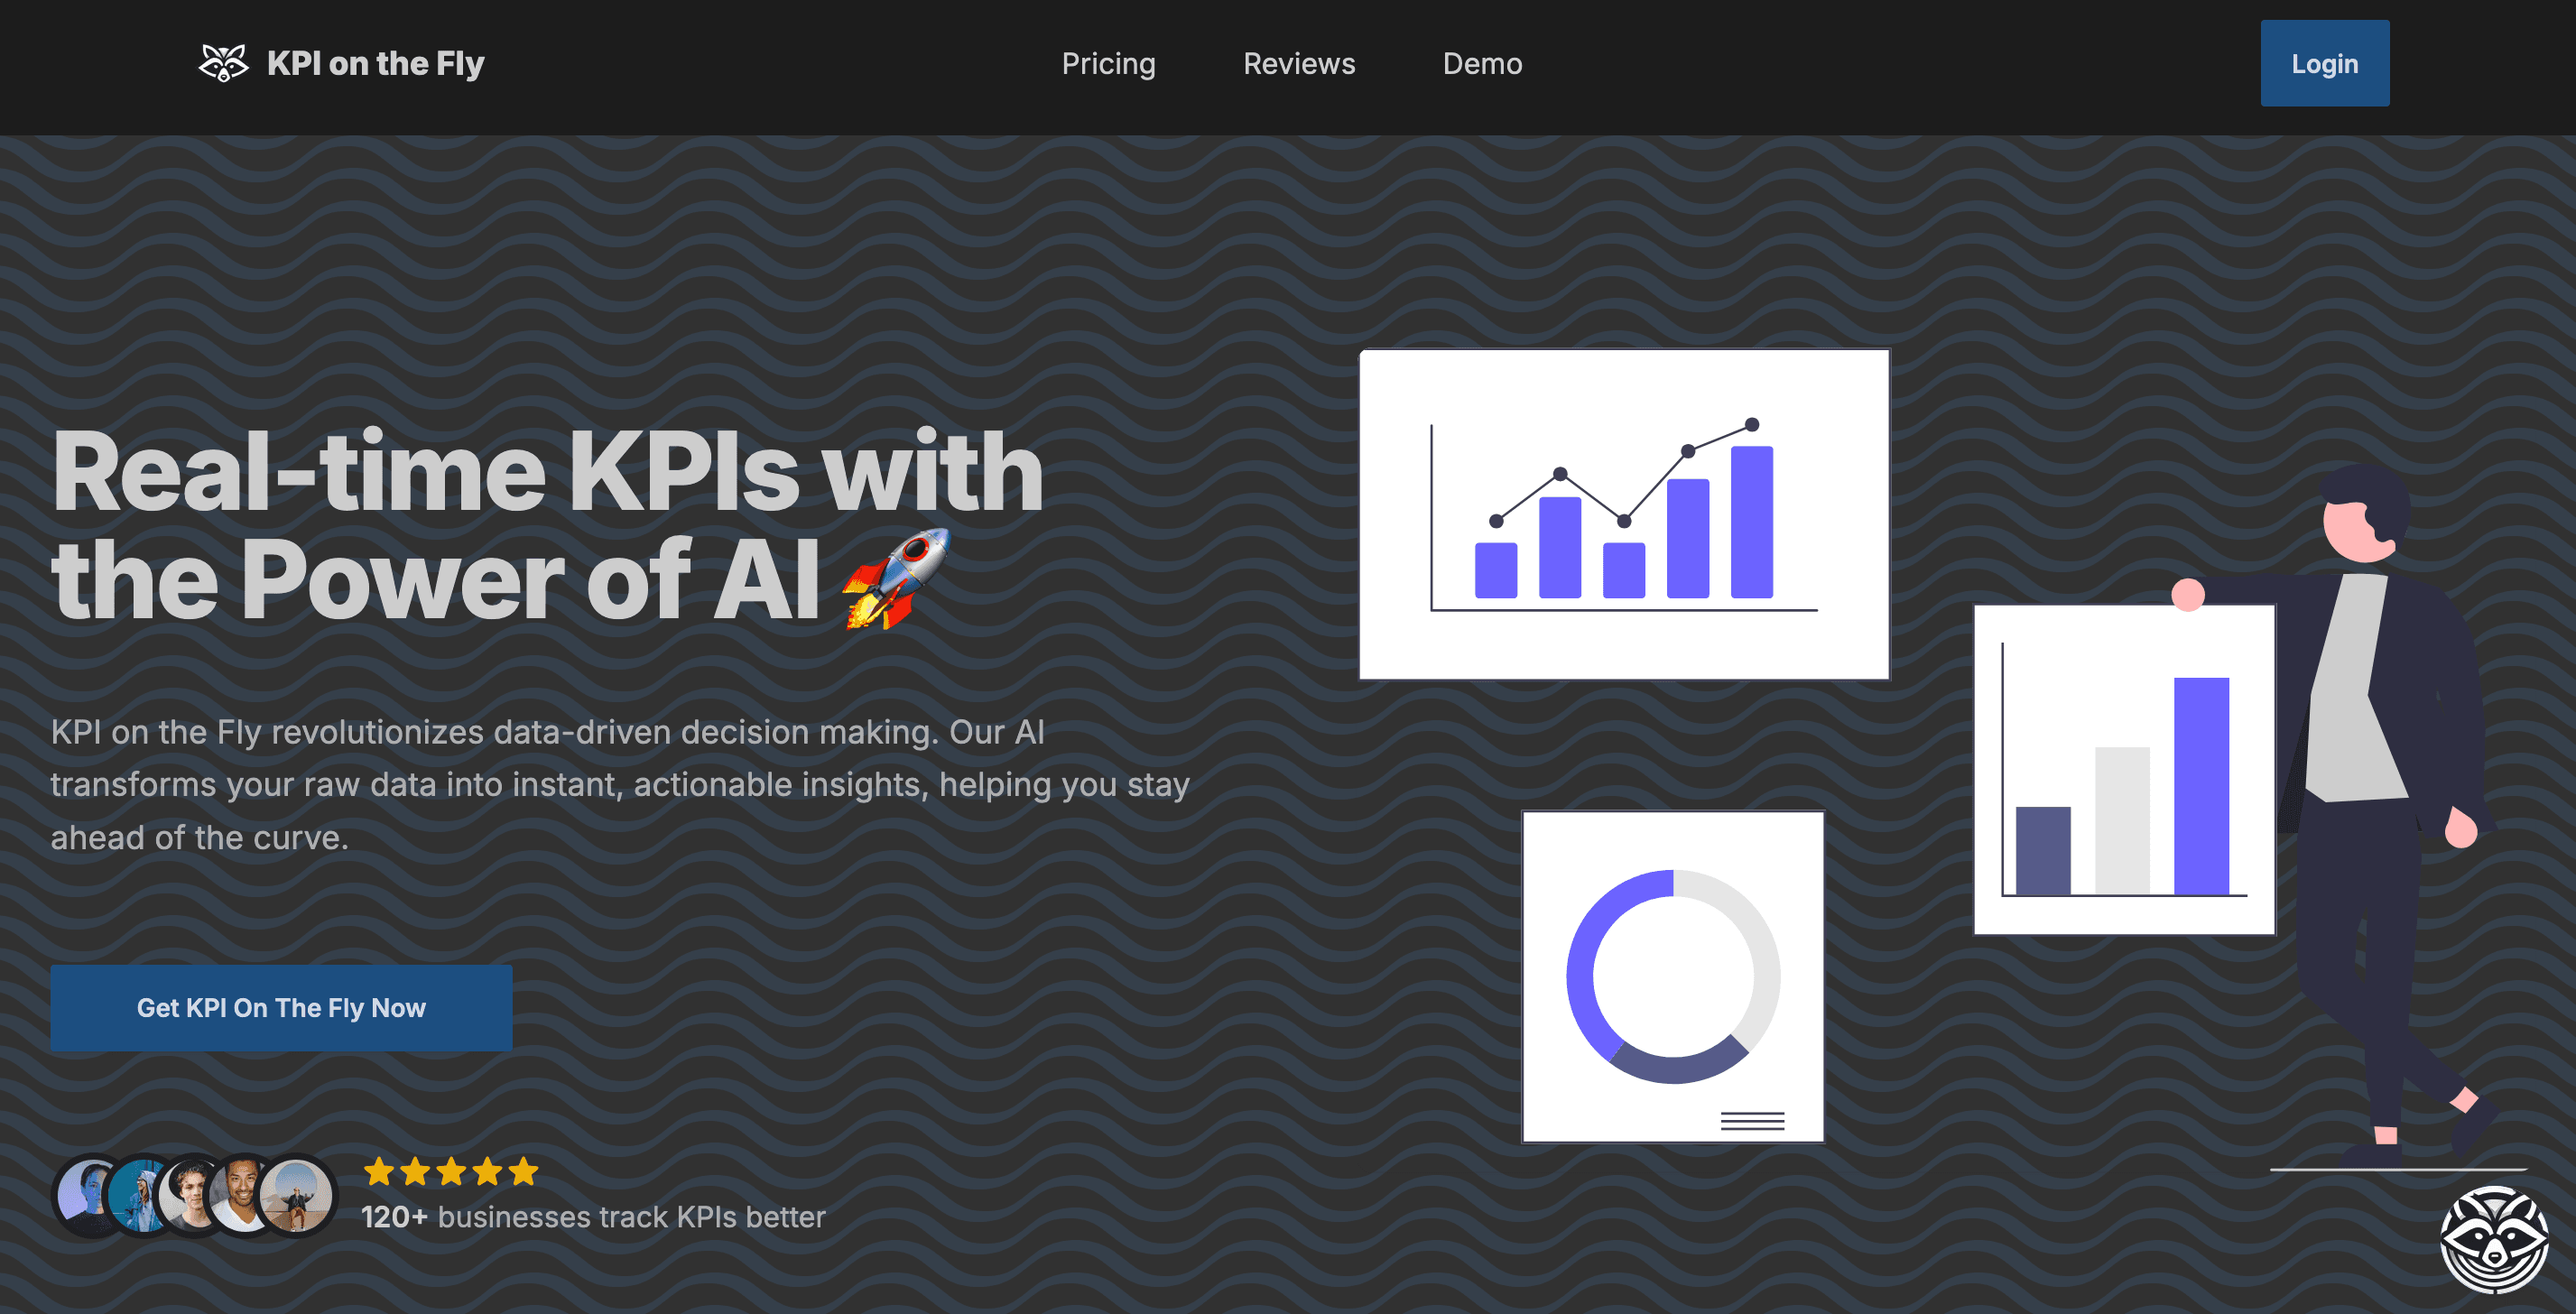
KPI on the Fly AI is my portfolio experiment in shortening the first-draft stage. It explores how an AI-assisted workflow can inspect a supplied dataset, propose possible KPIs, and assemble draft dashboard views for a person to review. A user can supply data and optionally describe the question they are trying to answer.
The result is a starting point, not governed business intelligence. Building it rearranged how I think about the relationship between automated drafting and accountable analysis.
What KPI on the Fly Actually Does
The whole flow is three steps, and I refused to let it grow a fourth:
- Upload your data. CSV, Excel, JSON, or even plain text. Whatever export you have on hand is enough to start.
- Describe your goal. An optional line of plain language — what are you trying to understand? — that steers the AI toward the KPIs that matter for your business.
- Review a draft. Inspect the proposed KPI cards, charts, and written observations before deciding what is valid or useful.
The workflow is intended to use the shape of the data and the stated goal when proposing measures instead of returning only generic row counts. It can suggest familiar chart forms such as bar, line, area, pie, or doughnut views. The concept also explores carrying reviewed KPI definitions into an Apache Superset workflow rather than leaving them in a one-off screenshot.
The point was never to replace a BI team. The point was to shrink the distance between a question and its first answer.
How It Changed My View of BI Work
Three lessons came out of building this — and none of them were the ones I expected.
The bottleneck was never only the charting. Modern tools can render a chart quickly. The difficult part of BI is translation: turning a business question into defensible measures, dimensions, filters, and queries. AI can assist with a first proposal, but a knowledgeable person still needs to test the definitions against the data and operating context.
A first draft is a different product from a single source of truth. KPI on the Fly does not produce governed, reconciled, audited reporting — and it should not pretend to. What it produces is a credible first draft while the question is still warm. Most analytical questions die in the queue waiting for a perfect answer; a fast draft keeps them alive long enough to matter. The governed layer — the kind of warehouse-backed reporting I build in my BI work — still matters. The draft is what tells you which of those dashboards are worth building properly.
Analysts do not get replaced. Some drafting can be shortened. The part of the job that carries value is judgment: is this KPI honest, is the underlying data clean, and does that trend mean what it appears to mean? None of that goes away. The opportunity is to reduce repetitive first-pass assembly so review can begin earlier.
That is the useful shift. When a system can propose a draft dashboard, the analyst can spend more time editing the logic, challenging assumptions, documenting caveats, and deciding whether the answer is fit for use. I would rather learn those boundaries by building and reviewing a prototype than by assuming automation is automatically correct.
This article is the canonical portfolio record for the experiment. My other prototypes are on the projects page, and the distinction between fast analytical drafts and governed BI work is exactly the kind of product question I enjoy discussing.
Key Takeaways
- KPI on the Fly AI is a portfolio experiment for proposing draft KPIs and dashboard views from supplied data and a stated analytical goal.
- The concept explores carrying reviewed KPI definitions into Apache Superset instead of stopping at a one-off view.
- A central BI bottleneck is translation—from question to measures to queries—and AI can assist with a first pass without replacing validation.
- Instant BI produces first drafts, not single sources of truth. The draft's job is to keep a question alive and show which reports deserve governed, warehouse-backed builds.
- The analyst's role shifts up the stack: less mechanical chart assembly, more judgment about whether the answer is honest.
FAQ
Does KPI on the Fly replace a BI analyst?
No. It explores how AI can propose a first draft. An analyst still needs to verify the source data, metric definitions, filters, queries, chart choice, and interpretation.
Are the generated KPIs a single source of truth?
No. A draft can help explore a question, but governed reporting requires agreed definitions, reconciled data, access controls, testing, ownership, and ongoing monitoring.
What is the role of Apache Superset in the concept?
The prototype explores moving reviewed KPI definitions toward a dashboard workflow in Apache Superset. That integration does not by itself validate the underlying metrics or data.